Discovering Preferential Voting: Three Levels of Understanding
Introduction
Voting helps groups make decisions together. However, the most common voting system, First-Past-the-Post, is often too limited. It can produce winners that many voters do not actually like, which may lead to tension, frustration, and a sense that some opinions do not matter.
A more modern alternative is preferential voting, also known as ranked choice voting. Instead of choosing only one option, voters rank the candidates in order of preference. This makes it possible to take into account a broader range of opinions. The main criticism of preferential voting is usually simple: people often feel that the counting is harder to understand.
In this article, we will explain preferential voting in a way that is easy to follow. We will start with a very simple explanation, then gradually move to more detail for readers who want a deeper understanding.
Let’s use a simple example. Imagine that the father of one of the students, who is a chef, volunteers to cook one dish for a student party. He will work for free, and the students will only need to pay for the ingredients. The students have three options: Chili con Carne (Meat for short, medium-priced), Grilled Salmon (Fish, higher-priced), and Chickpea Curry (Curry, lower-priced).
There is also an interesting dynamic in the group: the students who prefer Meat generally dislike Fish, and those who prefer Fish are not keen on Meat. At the same time, both groups are relatively neutral toward Curry.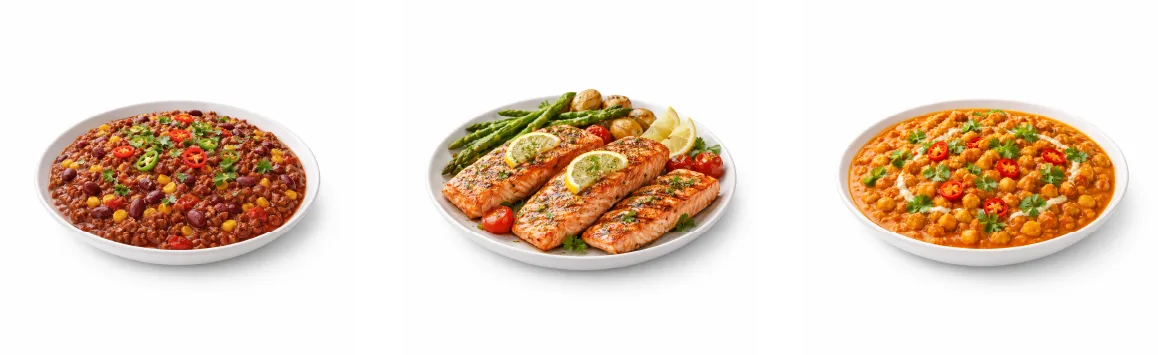
In a traditional election, the result might look like this: Meat gets 45% of the vote, Fish gets 40%, and Curry gets 15%. Meat would win because it has the largest share of first-choice votes. But this also means that 55% of the students preferred something else. Even worse, the Curry supporters might feel that their opinion does not matter at all and may be less motivated to participate next time.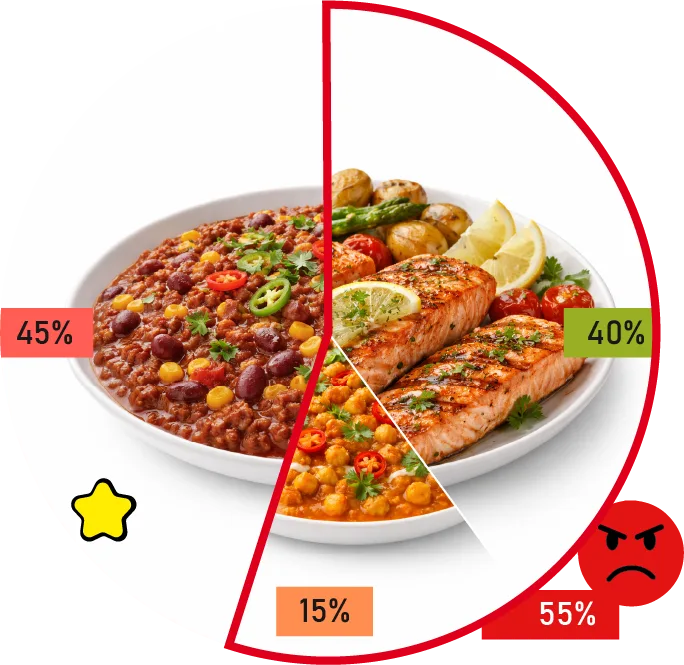
So what would preferential voting show us in a situation like this?
Level 1: The Simplest Explanation
Now imagine that instead of choosing only one option, students rank all three meals from most preferred to least preferred. The votes might look like this:
- 45% would go for Meat > Curry > Fish
- 40% - Fish > Curry > Meat
- 15% - Curry > Meat > Fish
Let’s use a very simple counting rule:
- a meal gets two stars for every first-place ranking,
- one star for every second-place ranking,
- and no stars for every third-place ranking.
The meal with the most stars wins.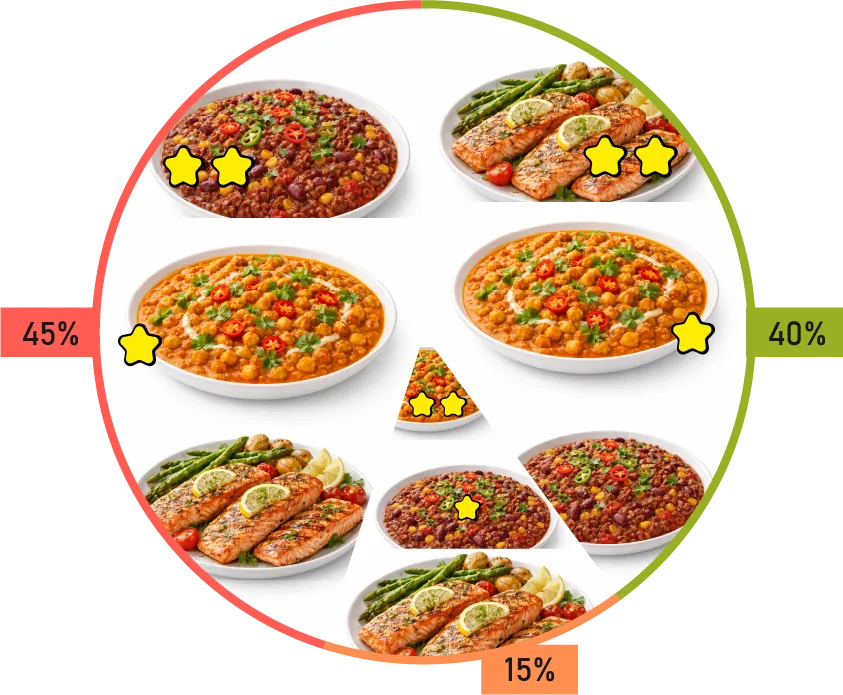
Meat scores 45*2 + 40*0 + 15*1 = 90 + 0 + 15 = 105 stars;
Fish = 45*0 + 40*2 + 15*0 = 0 + 80 + 0 = 80 stars;
Curry = 45*1 + 40*1 + 15*2 = 45 + 40 + 30 = 115 stars.
So although Curry was not the first choice of most students, it receives the highest total score. That tells us something important: Curry may be the best compromise. More people can live with it, even if it was not their top choice.
This is one of the key strengths of preferential voting. It does not only reward the most passionate group. It also values broader acceptability. In this example, every opinion matters, including the minority view. And because the result reflects the full range of preferences, fewer voters are likely to feel ignored or shut out.
The counting system we just used is called the Borda count.
Level 2: Going Deeper
Now that you understand the basic idea through the Borda count, let’s go a little deeper.
While the Borda count gives points based on ranking position, the Schulze method uses a more advanced approach. It is also known as the beatpath method. Developed by Markus Schulze in 1997, it determines the winner by looking at how candidates perform against each other in pairwise comparisons.
In other words, instead of asking only “Who is ranked first most often?”, the Schulze method asks questions like:
- How does Meat perform against Fish?
- How does Meat perform against Curry?
- How does Fish perform against Curry?
This makes the Schulze method a Condorcet method: it is designed to select the candidate that would beat every other candidate in a one-on-one contest, if such a candidate exists. Because of that, it is often considered more resistant to strategic voting and manipulation.
Let’s apply the Schulze method to our student meal example. We use the same preferences as above: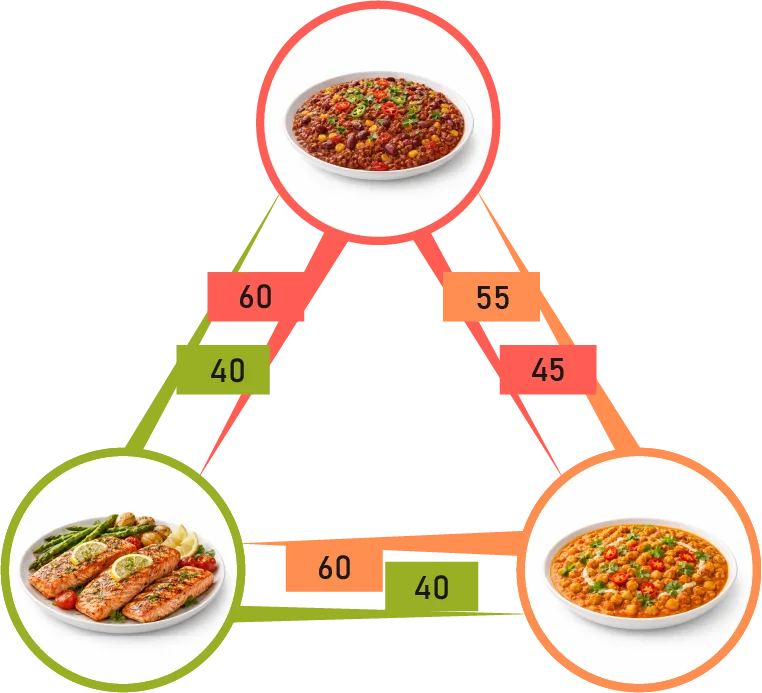
- 45% Meat > Fish > Curry
- 40% Fish > Curry > Meat
- 15% Curry > Meat > Fish
Now, let’s go step by step:
- Pairwise comparisons:
- Meat vs. Fish: For Meat = 45 + 0 + 15 = 60; For Fish = 0 + 40 + 0 = 40.
- Meat vs. Curry: For Meat = 45 + 0 + 0 = 45; For Curry = 0 + 40 + 15 = 55.
- Fish vs. Curry: For Fish = 0 + 40 + 0 = 40; For Curry = 45 + 0 + 15 = 60.
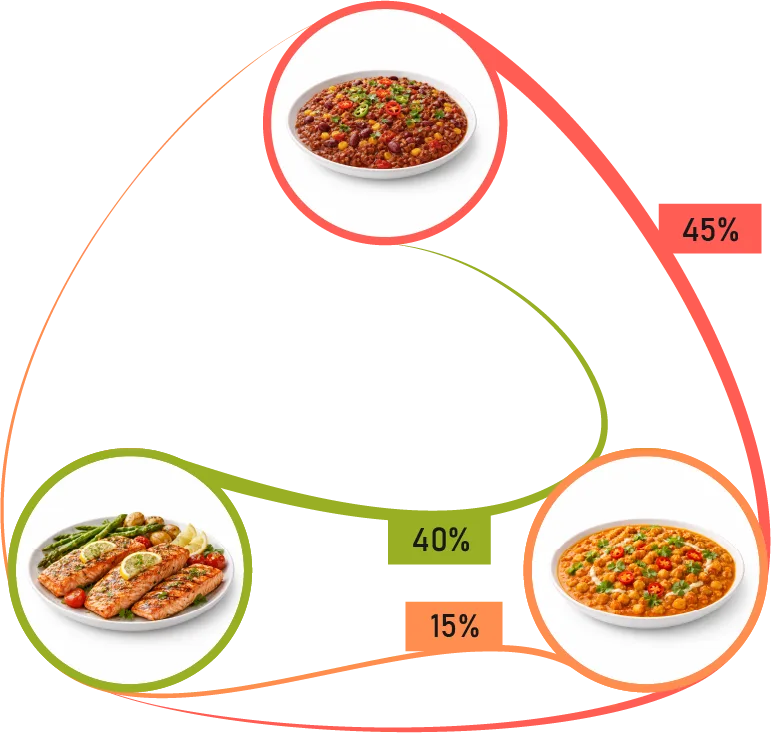
- Strength calculation:
- Meat -> Fish = 60 - 40 = 20
- Curry -> Meat = 55 - 45 = 10
- Curry -> Fish = 60 - 40 = 20
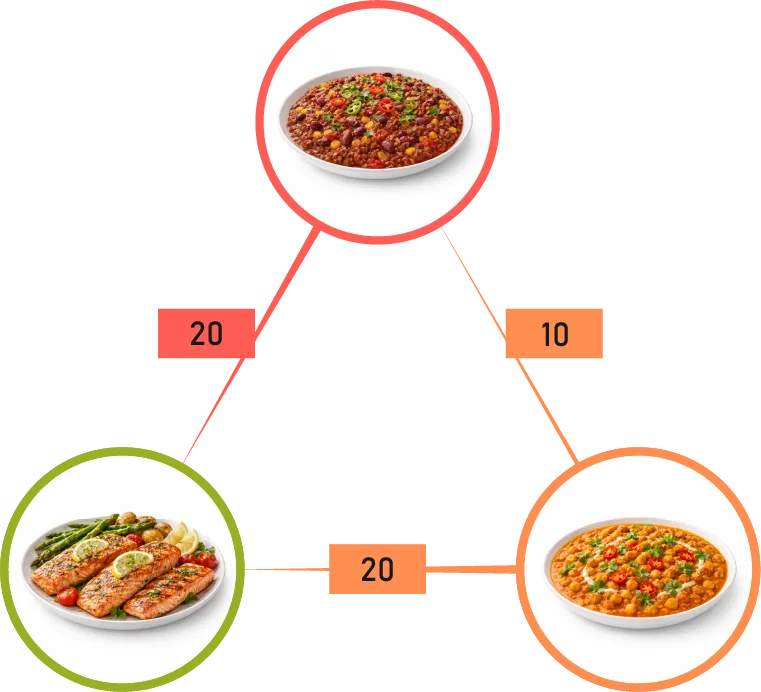
- Beatpath comparison:
- Meat -> Fish -> Curry = 20 + (-20) = 0
- Meat -> Curry -> Fish = (-10) + 20 = 10
- Fish -> Meat -> Curry = (-20) + (-10) = -30
- Fish -> Curry -> Meat = (-20) + 10 = 10
- Curry -> Meat -> Fish = 10 + 20 = 30
- Curry -> Fish -> Meat = 20 + (-20) = 0
- Winner
The strongest path here is Curry -> Meat -> Fish with 30 points.
At first glance, the Schulze method may seem much more complex than a simple point system. But the reason many people value it is that it tries to reflect voter preferences in a more robust and nuanced way. Instead of looking only at top choices, it examines the structure of preferences across the whole group.
That makes it a powerful method for producing outcomes that are not only democratic, but also broadly representative.
Level 3: Even More Details
For readers who want a more technical view, let’s look at a fuller example with a complete distribution of preferences:
- Meat > Fish > Curry: 6%
- Meat > Curry > Fish: 39%
- Fish > Meat > Curry: 4%
- Fish > Curry > Meat: 36%
- Curry > Meat > Fish: 7%
- Curry > Fish > Meat: 8%
This time, let’s label the options more compactly: A = Meat, B = Fish, C = Curry. The same vote distribution becomes:
- ABC 6%
- ACB 39%
- BAC 4%
- BCA 36%
- CAB 7%
- CBA 8%
We will also use a matrix representation, which is common in explanations of the Schulze method. We begin with the Pair Win Matrix, where the rows show the candidate and the columns show the opponent.
A over B = 6 + 39 + 7 = 52, and B over A = 4 + 36 + 8 = 48.
A over C = 6 + 39 + 4 = 49, and C over A = 36 + 7 + 8 = 51.
B over C = 6 + 4 + 36 = 46, and C over B = 39 + 7 + 8 = 54.
Now let’s build a Path Strength Matrix, where the weaker directions are excluded:
- A -> B = 52
- A -> C = 0
- B -> A = 0
- B -> C = 0
- C -> A = 51
- C -> B = 54
Now let’s compare all the possible paths:
- ABC = 52 + 0 = 52
- ACB = 0 + 54 = 54
- BAC = 0 + 0 = 0
- BCA = 0 + 51 = 51
- CAB = 51 + 52 = 103
- CBA = 54 + 0 = 54
In this case, Curry (C) wins again with a significant margin.
At this level, we can clearly see that preferential voting is not just about identifying the most popular first choice. It is also about identifying the option that stands strongest when we consider the full structure of preferences across the group.
Conclusion
Preferential voting methods such as the Borda count and the Schulze method offer a more inclusive approach to collective decision-making. By taking into account not only voters’ first choices but also their broader preferences, these methods can produce outcomes that are more representative and, in many cases, more acceptable to the group as a whole.
They can be useful in many settings: political elections, community decisions, clubs, student groups, teams, and even informal group choices like the meal example used in this article.
The more we understand these systems, the easier it becomes to see that democracy is not only about choosing a winner. It is also about making sure that people feel heard. Preferential voting helps move decision-making in that direction by giving more value to the full range of voter opinion.
Comments